PedGo
The program PedGo is the core of the software package. It runs the simulation for the preprocessed project files from the editor and provides the results for analyzing the situation.
All persons in the simulation basically use the same movement algorithm. To take the variation of abilities into account, every person has her own parameters that influence her behaviour. Of course, the list of factors affecting a persons movement is nearly endless. However, at the end of the day, the movement of a person from a physical point of view is only characterized by her speed and her direction. This way, the number of parameters characterizing the abilities of a person was reduced to six.
Parameters
All parameters are assigned optionally by normal distributions with cutoffs (min/max value) or by equal distribution.
|
|
The demographics-dialog of PedGo.
|
Clustering
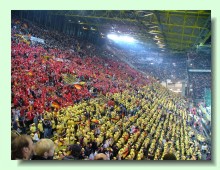
In addition to the six parameters there is the possibility to configure the clustering of each group, in order to consider the influence of persons walking in a clustered group (e.g. families). An example to demonstrate the effect of clustering is shown in the following.

50 persons moving without any group binding through a demonstration vessel.
|

50 persons moving as a cluster.
|
Maybe you have already noticed it: because of the statistical distribution of the parameters, the result of the simulation can vary a lot. Next to this, statistical decisions of the persons, while walking, again spreads the outcome of the simulation. This is why every simulation run provides a different evacuation time, just like in reality!
For a complete evacuation analysis, about 500 simulation runs are performed. They deliver a satisfying overview about the possible outcome of the evacuation. Take a look at our results-section, to get an impression, of what the simulation can determine for you.
Because of the many simulation runs which are neccessary for a satisfying statistical analysis, it is obvious, that simulation speeds are of great importance.
|
|
Screenshot of PedGo, simulating the evacuation of the two aft firezones of a cruise ship.
|
Results
The evacuation simulation generates a huge amount of data. This comes from the many simulation runs which are neccessary for a statistical analysis and because the data of every single person is collected.
PedGo generates formated textfiles that can be directly imported into most spreadsheet applications, bitmaps of densityplots or screenshots, animations and in near future a logfile to generate 3D-animations. The following examples show, how the results can be evaluated.
A complete evaluation of an evacuation analysis can be downloaded from the
download section.
Results of a mean value simulation
At first, a so called mean value simulation is performed. She consists out of many evacuation runs (e.g. 500) and gives you an overview, in what range the results can spread.
|
Distribution of evacuation times
The distribution of evacuation times shows you, how much the result spreads and how it is distributed.
In this example, the mean value is marked green.
|
|
|
Evacuation curve
The evacuation curve shows you, how many people were saved at a certain time during the evacuation.
This is logged for every simulation run. Out of these values, a statistical evaluation can be derived,
so a curve for the run representing the mean, the minimum and the maximum case is generated.
|
|
Results of a single simulation
After the mean value simulation is done, specific runs can be repeated to gain the following results:
|
Person data
For a single run, a file containing the data of the persons can be generated.
For each person, her starting and finishing coordinates, walking time, walking distance,
parameters and the distribution of walking speeds are saved. This data can be evaluated in many ways.
|
|
|
Exit Details
The data gathered from the single run contain the progess of the evacuation of each person. The extraction of the data of the specific exit is uncomplicated. Thus evacuation curves for
each exit can be prepared. Furthermore the evaluation of the person flow of each exit is possible.
|
|
|
Logpoints
With the setting of a logpoint in the editor it is possible, to count the persons in a defined area depending on the evacuation time. On the basis of this data, the evacuation of single
rooms, corridors or floors can be evaluated. Another area of application is the evaluation of person densities in a pre-defined area.
|
|
|
Animations
In order to visualize the evacuation process, PedGo can create an animation or screenshots in certain intervals.
The persons are represented by moving dots. Their color thereby varying between green (maximum speed)
and red (standing) lets you immediately detect queues.
|
|
|
Plots
Plots give you a graphical overview of what happened during the evacuation. In this case,
a densityplot is shown. The red cells are marking the areas, where a significant density
was exceeded for one quarter of the overall evacuation time or longer.
|
|
System Requirements
Since it has been one focus of the model development and implementation, to reduce the need for high system capacities, the requirements for the use of PedGo are moderate.
- System: Microsoft Windows '95, '98, NT 4.0, 2000, XP, Vista or 7
- CPU: minimum an Intel Pentium with 90 MHz
- Memory: 128 MB RAM is sufficient for large vessels and facilities
- Graphics: XGA with 24bit color depth and a resolution of 1024x768
- USB Slot
Direct Links
Top
|


 Company